Call us today at 1-800-ISO-9000 to find out more about our QMS software system.
Learn more and why clients use (HQMS) Harrington’s Enterprise Quality Management Software below:
What is a Quality Management Software System?
A QMS Software System, referred to as Quality Management Software System can be described as a formalized system that manages processes, procedures, responsibilities, and performance to be able to achieve quality policies and objectives within an organization.
Software for Quality Management can help coordinate and direct business objectives and activities along the right path to meet customer and regulatory requirements. Quality management is performed to improve business effectiveness on a continuous basis.
There are multiple definitions for regular Quality Management Systems. Most of those definitions emphasize the use of a QMS stating they are repeatable, measurable, and continuously developing over time.
An ISO 9001 system is structured in a way that allows the delivery of better services or products that are supported through documented information. This documented information involves procedures, work instructions, and policies.

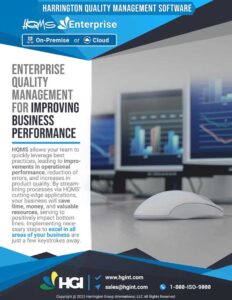
Harrington Quality Management System (HQMS) is our flagship World-class software for Enterprise process improvement, Compliance, and quality management. Over 100k Users and counting on HGI Software Systems
What exactly is an ISO standard in terms of QMS Software Systems?

An ISO 9001:2015 standard can be defined as an international standard that specifies requirements for the quality management system. This standard is used so organizations can develop their own programs for quality control. This approach is the most prominent for Quality Management Tool.
While some people use the term “Quality Management Software” as a term to describe the ISO 9001 standard or the group of documents that details the process, it represents the entirety of the system. The documents used to detail only serve to describe the platform.
This standard applies to all organizations regardless of the company’s size or industry. Different companies worldwide have used for the ISO 9001 standard for their Quality Management requirements.
Using the ISO 9001 standard for organizations would help them:
- Organize their processes for efficiency
- Ensure there is an improvement in the effectiveness of their operations
- Make sure there is continuous improvement in their business processes
Elements and requirements for Quality Management System:
Although different Quality Management Systems should be developed and molded to fit each organization’s unique needs, all software has some general properties in common. These properties include:
- Management of Data
- Internal processing of organizational information
- Customer satisfaction through high-quality products
- Identifying areas for improvements
- Quality Analysis
Each element of all Enterprise Quality Management Software or QMS software systems is utilized to serve the purpose of achieving the end goals of an organization’s requirements and meeting customer needs. Ensuring that each element of the software is available to meet these requirements would guarantee the proper execution of the software.
Implementing new software in an organization may seem incredibly complicated. With all the required procedures, work, training, and costs, only one thing comes to mind: Is it worth it? Before attempting to skip ahead in time and find out if it’s worth it, it is essential first to know what exactly QMS software is and if your organization needs one.
Does your company require a Quality Control Software?
When the administrator of a company considers a QMS, with all its popularity, the first thing, he/she should do is evaluate the need.
Some organizations may not even require a QMS, for that reason it is vital to identify if your company needs it. Implementation of a QMS into a company that does not require one could result in:
- Loss of productivity
- Loss of profits
- Difficulty locating documents
Possible reasons for QMS System implementation failure:
It is often found that in many cases, organizations that have QMS implementation failures often blame the software. However, this is an incorrect representation. In most cases, the implementation failures are due to the process of implementation being performed incorrectly. There could be multiple reasons for QMS implementation failures. A few of which could include:
Some organizations find themselves following a trend and blindly implementing every software that gains popularity. This is usually the first downfall of having a QMS failure within a company.
Even if there are sufficient funds available, in some cases, software customization could increase risk, require a longer time, and could cost more to perform in the long run.
User training is an incredibly critical factor when it comes to just about any software to be implemented into an organization. Insufficient training could put the company productivity at risk by leading to increased production errors and incorrect output of products.
Software testing should be done following a variety of steps. When performing software testing, it is vital to identify if the correct software has been purchased. The system should comply with the requirements of the company, and users should determine how efficient the QMS would be in the organization. Without proper testing, there could be an increase in risk for the company.
These factors are only a few of the many possible failures a company may face through QMS implementation. Therefore, when considering a QMS, the importance of research on this software shouldn’t be ignored.
Why you should choose a QMS Software System
Through the utilization of a quality system management software or QMS software system in the right way, it could be significantly beneficial to a company offering the following advantages:
- Improvement of processes
- Significant waste reduction
- Less unnecessary company spending
- Opportunities to improve and document training processes
- Identifying broad business objectives
Utilization of a Quality Management platform has become a must-have in the current age. However, the implementation of a QMS should always be able to reflect the critical needs of a business.
To ensure that an effective strategy for Quality is pursued, the following factors should be what your quality control software delivers:
The delivery of accurate information should be available in every system. For each process, policy, or procedure in the company, it is essential to keep in mind there can only be one form of correct information. That information should be the only one present throughout the system and should be available to all employees that are granted access to it.
While in an automated system, data may be readily accessible by the relevant employees. But how often are there times when you just don’t understand the bulk of information in front of your screen? It would be far more convenient for users if the information was presented in different formats. The efficiency of newer more advanced systems would allow information to be visually represented for a better understanding for users of the QMS.
For all employees with authority within the company to be able to access all information easily, the records and documents should be available in a central and easily accessible location. For this, information uploaded online can offer significant ease for each employee to access files quickly. Documents can then be a click away for better productivity.
One of the primary reasons for the use of a QMS is efficiency. Therefore, the ability to access the relevant files on time is vital. Because of this, if files can be accessed on time, organizational productivity could be increased significantly.
Your Quality Management Software should be able to hold information for all the necessary aspects of the company. The system should be able to deliver intelligent, powerful, and high-quality reports. These reports could then be used for reference and other essential activities.
With nearly every person having a smartphone or laptop in the current world, it would only make sense that the software holding all necessary files would be accessible on other electronic devices as well. This is primarily a necessity for employees that travel frequently.
All Quality Management Systems should be able to follow the regulatory standards issued by the manufacturers to avoid legal problems.
The QMS should be able to provide a basic view for all procedures, documents, policies, and other information relevant to the company. This could be essential to have an overview on how the organization operates.
This is a factor that doesn’t get much attention. Having up-to-date software could provide significant insight to increase productivity, could be easier to operate, and could also reduce errors and unnecessary costs in the long run.
Factors to consider before implementation of a QMS System:
In some cases, some organizations still find themselves using conventional document handling processes. However, this is generally because those organizations are simply more comfortable that way. Others, however, may be hesitant to upgrade to Quality Management Systems. Because of that, the following questions may arise:
- Are the employees competent enough to manage a Quality Management System?
- Can company data be hacked and misused?
- How complicated would the new system be?
- What happens to the physical documents?
- Would maintenance cost a lot?
Therefore, before implementing a QMS software in a company, taking the time to do the necessary research would ensure the company is presented with the perfect QMS.
Once a company has decided a QMS is right for them, there may be multiple questions regarding the system such as:
- Where to begin?
- How beneficial would the system be?
- What unique features would be provided?
- Would the cost and maintenance be worth the implementation?
Understand the factors before QMS System implementation:
- Product cost
Purchasing any new software that would handle company data is a big deal overall. The impact the system could have would bring a significant change. Every company needs to ensure the implementation of any new software is cost-efficient. This is not only because of the software cost itself but because various other charges may follow. These costs could include Training costs, Implementation costs, Trial and error costs, and Costs of redoing failed products. These systems are a lifelong commitment. Ask yourself, how much is your company willing to spend on Quality Management tools. - Business objectives
The primary reason for an organization to seek the implementation of new software to manage their quality-related documentation is to improve efficiency. Supporting and expanding company objectives can be achieved through the competent use of these systems. Organizations can also gain improved productivity and achievement of long-term goals through an efficient QMS. Companies need to ask themselves: Is the growth of the company assured? Would these procedures guarantee efficiency? - Would time be well spent?
To be able to make use of a Quality Management program effectively, the head of the organization needs to make sure the employees are willing to spend as much time as required to get the maximum use of these systems. Additionally, the company should ask themselves if there is going to be sufficient time to put aside for the management and maintenance of the new system. And if so, would that time be well spent? - Efficient and up-to-date software
Expensive Software doesn’t always mean better products. In fact, when considering the right QMS, it is essential to make sure the qualities of the QMS comply with the organization’s requirements. This would, in turn, guarantee efficiency. Up-to-date software could significantly make users’/employees’ lives easier through Faster productivity, easier handling of documents, and more added features. These items would improve the performance of employees. For an organization to move forward in the current competitive market, HQMS iso management software is a great support. These systems would guarantee that any company would receive the boost it requires. Organizations can ensure maximum efficiency, increased productivity, and higher profits through that.
Quality Management System Software Return on Investment:
The following methods can be used as a baseline for accelerating a Return on Investment on ISO 9001 Software:
- Strategy one: Identifying the right Quality Management System for the company. Additionally, the processes to be used for the system should be determined and streamlined for process improvement.
- Strategy two: When initiatives are executed, the speed of the implementation for those executions should be considered. The faster these processes are implemented, the higher the chance becomes for gaining a significant Return on Investment.
- Strategy three: The system to be chosen should be able to comply with the production standard to satisfy customer requirements. Customer satisfaction is the goal of any company. If production standards are low through improper quality management, the output could be faulty. For this reason, making sure the system can follow through with the quality standards could guarantee customer satisfaction, which would, in turn, generate a better Return on Investment. This strategy is especially applicable to manufacturing companies.
- Strategy four: The chosen Quality Management System Software should be able to meet current and potential future initiatives. The Quality management processes would generally develop, and the system that’s selected by the company should be able to keep up with these changes.
With all the information provided above, companies can create a better organizational vision in the long run. However, it is essential to keep in mind this vision would require constant updating for it to be effective. The same approach can be directed to ensure organizational efficiency with a Quality Management System. If you’re looking to acquire one of the best Quality Management Software in the industry, Harrington Group International is the way to go.
Why You Should Chose HGI Software for QMS Solutions for your Business?
Harrington Group International (HGI) is an organization that issues some of the best software solutions to companies worldwide. Through our long-standing reputation for the best software solutions, here at HGI, we only guarantee the best services for each client.
Our Harrington Enterprise Quality Management System (HQMS) is our flagship of world-class software. Our HQMS Software provides potential clients with a state-of-the-art solution for quality management plans. Our software guarantees that clients would be provided with quality monitoring and assurance to ensure they get their products ready and compliant for business processing.
Here at HGI, client requirements are the priority, and we ensure each HQMS Software purchased would be customized according to the needs of clients while offering some of the most beneficial services. These services include:
- Software Training
- Implementation
- Application development
- Application hosting
- Report modification
We bring knowledge and in-depth functional expertise while guaranteeing a practical approach to build capabilities to deliver an authentic impact to ensure organizational efficiency.

FAQs for Quality Management Software
What features does HQMS offer?
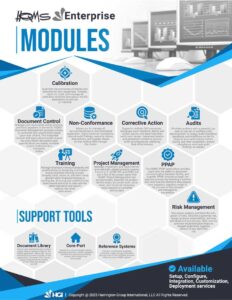
HQMS is our flagship product with extensive capability, including but not limited to: Document Management, Training, Audits, CAPA, Material Nonconformance, Calibration, Project Management, Risk Management, and PPAP Management.
In addition, our Supplier Portal software features Receiving Inspection, SCAR, Deviation Requests, PPAP, Nonconformance and Debit Memo.
Stand-alone point solution software includes Corporate Action for consolidating standalone task trackers, Calibration, and PPAP Document Authoring.
How does your software help with process automation?
HQMS has a robust use of workflow and business rule technology to automate repetitive and manual tasks within complex quality management processes.
This software streamlines processes for simplicity, achieves digital transformation, increases service quality, and improves service delivery, all the while reducing costs.
HQMS does not include robotic process automation (RPA) or intelligent document processing (IDP).
Can your software be integrated with existing systems?
Yes, integration is often incorporated into HQMS deployments; mostly ERP systems like QAD, Oracle, Microsoft Ax, SAP, Sage, SysPro, Epicor, JDE. Other applications include PLM and MES software and legacy apps.
How does the software support document management?
HQMS software tracks the entre document process through creation, revision, approval, and release. It secures your documents with controlled access to both sensitive documents and basic documents. Furthermore, it provides a complete audit trail of the process, to include change control and revision history.
Does the software support real-time data analytics and reporting?
Yes, including configurable Executive Dashboards and module specific reporting and charting. Routine reports can be saved for ease of access.
How user-friendly is your Software?
Customers tell us that HQMS is the fastest and easiest software they have ever deployed.
What training or support services do you offer to ensure smooth adoption of the software?
We offer a tailored two-to-three-day training for Administrators and one-to-two days of training for users. Larger training deployments are offered with customized corporate training. Contact [email protected] for your customized training program.
Can the software be customized to our organization's needs?
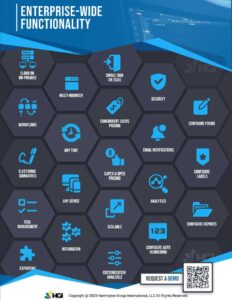
HQMS was designed to support custom configuration by the Customer.
The customer has the ability to configure settings without modifying the original source code, including but not limited to:
Screen field labels, Audit Trails, Email Settings, Auto-Numbering for records, Business Rules, form tabs content, List filters and content, Lookup tables – validated keywords, Notifications and Emails, Mouse over fields, Password configuration, Report filters and content, Security Rights Management and many more.
How does your QMS software ensure compliance with industry quality standards?
With over 40 years of experience and working with a variety of industries and their associates, HQMS supports multiple industry quality standards. During the onboarding process, Customer specific questions are addressed to ensure compliance to industry standards.
Can your software help us prepare for ISO 9001 or other industry-specific certification audits?
Yes, ISO9001 is a common standard used by our HQMS customers. Customers have indicated their audits are completed faster and with less or no findings. Our software will help you to become ISO certified and has been recommended by various HQMS auditors in the quality management arena.
Does the software support Risk Management in compliance with ISO 31000?
Yes, the HQMS Risk Management module provides the systematic application of management policies, procedures, and practices. This application applies to the tasks of communication, establishing the context, identifying, analyzing, evaluating, treating, monitoring, and reviewing risk.
What data security measures do you have in place?
As a software provider to highly regulated industries, the data security measures are robust, to include data encryption and revolving aging password uniqueness. Our security measures also include authentication attempts and automatically enforce length requirements. The network design has an impressive firewall, ACL's, IP Spoofing, network reconnaissance, and trust exploitation technological functions in place. All of our software has customary virus/malware scanning in place, to further protect security.
How does the software comply with data privacy regulations like GDPR and CCPA?
HQMS supports General Data Protection Regulation (GDPR) requirements for properly handling personal data, as defined in the law with encrypted User information. In regard to the California Consumer Privacy Act (CCPA), our software enables companies to retain consumer information and access said information on demand. Furthermore, a full list of all third parties that data is shared with is not often required as a requirement to input into the HQMS as personal data.
Do you offer different packages depending on the size and needs of our organization?
The product line of HQMS and stand-alone software is intended to support a wide spectrum of various-sized organizations. A HQMS Starter Kit allows a selection of 4 modules to get started and can be expanded, as needed. Small orders are welcome!
How is your software priced?
Pricing is flexible and adaptable based on Consumer needs, including but not limited to:
- Hosting or on-premise deployment
- CapEx and Opex models
- Number of concurrent users
- 1, 3, and 5-year agreements
- Integration and Customization, as needed
How easily can your software scale as our organization grows?
Scaling is a proven and valuable HQMS feature. Current sizable and long-term global customers often start with a single plant engagement. The proven results have then expanded across multiple facets of the company. For small businesses, the HQMS Starter Kit approach provides a low-cost, low-risk investment that often enables the business to continue to grow and expand.


